


Seeing All The Evidence
Seeing All The Evidence
Too often, we misinterpret data because we only see what is there, in number, in quantity, in color and not what isn't there but still a vital part of the picture and story.

I confess - I’m not that strong when it comes to math. It always was my worst subject in school. Thank god I had some compassionate and patient teachers during my schooling. But amazingly, in my graduate research statistics courses, I was top of my class and aced them all. Why? Well, statistics doesn’t just consist of data, mathematics, and number crunching. That’s part of it but only a small part. There is a lot more to sound statistical analysis and presentation than mathematical formulae.
“You know my method. It is founded upon the observation of trifles.” Sherlock Holmes to Watson.
It is amazing how people can look at the same data, the same facts, the same results, the same situation and come to radically different conclusions. It is really one of the core narratives of the recent pandemic. Why? Well, one of the biggest problems beyond that of criminal data manipulation IS that we don’t account for what isn’t enumerated, shown.
It’s what isn’t told, shown, right in front of your nose that is often the most important when interpreting data.
As most of you know - a magician seems to do magic because he distracts you with what is there. You focus on the red scarf or the lights shining on an object. Meanwhile, you don’t see the magician quickly rearranging reality. So, you come to a poor conclusion - it’s magic! Magic is the art of deception (the hidden) and so too can be statistics if done poorly.
A story to begin. [I got this from Facebook and made a comment which then spiraled to 100s following up to my own comment. So I present it here and my own thoughts below. Please comment and leave your own valuable commentary, and contribution. ]
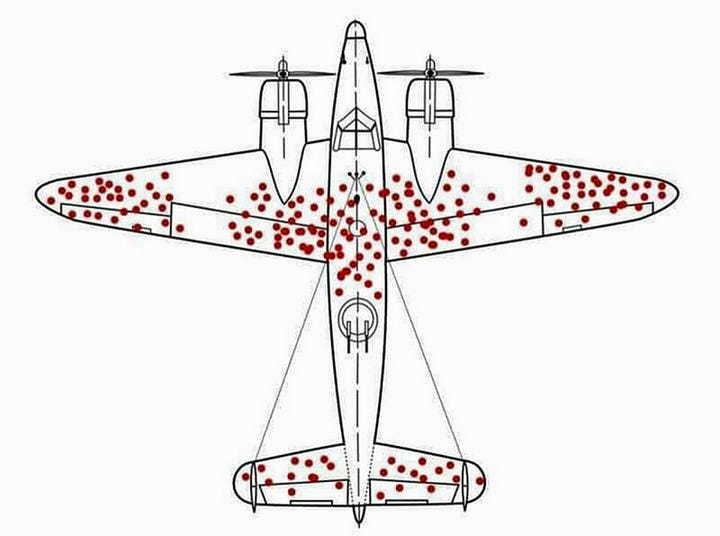
During World War II, fighter planes would come back from battle with bullet holes. The Allies initially sought to strengthen the most commonly damaged parts of the planes to increase combat survivability. A mathematician, Abraham Wald, pointed out that perhaps the reason certain areas of the planes weren’t covered in bullet holes was that planes that were shot in certain critical areas did not return. This insight led to the armor being re-enforced on the parts of returning planes where there were no bullet holes. This wisdom was also beneficially applied to the Skyraider during the Korean War. This shows that the reasons why we are missing certain data may be more meaningful than the available data, itself. In questions of aircraft design, don’t only listen to what the evidence says, listen also to what is not being said.
This story is a great example of “survivor” bias. But it illustrates a lot more concerning how we see and interpret data.
There is a big truth in this “joke”.
A study was done on those who played recreational Russian roulette. They interviewed those who played this game. It was found that 100% who played, survived. It was concluded that Russian roulette was not that dangerous a game and didn’t warrant any action by authorities.
A few more stories to illustrate the point.
Years ago when tires weren't as reliable and money was short, people would buy 2 tires, install them on the front wheels because they knew steering was important, and place to 2 best remaining tires on the rear. The National Safety Board took a few years, studied auto accident records, determined that the rear tires on an auto were most subject to failure and advised the public in a massive campaign that we should always place the newer, the best tires on the rear wheels.
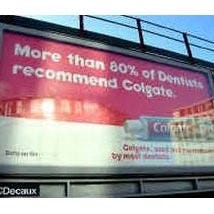
Colgate collected data from dentists. They wanted to know which toothpaste the dentists recommended. It was found that 80% of dentist’s listed Colgate and that “fact” become a central message in a decade’s long advertising campaign. What they didn’t tell you, show you, was that dentists could list up to 5 kinds of toothpaste they recommended. Some brands were recommended by all dentists - not Colgate!
A study in the 1920s measured the IQ of criminals in prison. The average IQ of a criminal in prison was found to be much lower than the average in the general population. So, the conclusion was that criminals are much less intelligent than the average Joe or Jill. However, what was wrong? They didn’t measure the IQ of all the criminals not in prison - because of course, they weren’t there because they DID have much higher IQs.
I hope you get my point - vis a vis “the invisible” and what isn’t there.
A problem with statistics is too, the tools used. When you only have a hammer, everything you see is a nail. Too often we use a microscope where a telescope is needed. Or we don’t provide contrast and without contrast, a picture really can never truly, fully be seen.
Now, there are many causes of data misinterpretation, bias, and “cheating”.
Here are a few:
Small sample sizes (Pfizer so guilty).
Too many confounding variables and factors not accounted for.
Errors in data collection and sampling.
Poor contextualization and poor defining of variables.
Errors of aggregation and omission.
Invalid statistical significance.
Cognitive bias. Self-selection errors of relevant data.
Errors of correlation. Improper claims.
Data visualization errors (incorrect scaling, wrong graph, data omission).
FALSE CONCLUSIONS.
My comment on the Facebook post about the fighter plane story that had garnered a lot of attention, suggested it was also a strong metaphor for medicine n public health. There is too much treatment of symptoms (the visible, the specific) and not the underlying causes (the invisible, non-specific). A proscriptive vs prescriptive approach. Symptomatic medical models and treatment vs wholistic and social models and patient treatment.
“Circumstantial evidence is a very tricky thing. It may seem to point very straight to one thing, but if you shift your own point of view a little, you may find it pointing in an equally uncompromising manner to something entirely different.” Sherlock Holmes to Watson.
The Covid 19 pandemic will go down in history as one big fandango when it comes to data interpretation and to the point, misrepresentation. I won’t go into this in detail, I’ll leave it for another post.
But a couple of points I can make are;
Seek out information from a statistician that is well educated, versed, credible, and without any skin in the game (conclusions). This cancels out most of the media (that do a horrid job of displaying biased data results), and official organizations (who want to show data to gain a specific public response). I recommend @boriquagato when it comes to competent statistical inference.
Look at the data yourself. Think about it. As I said, I’m no rocket scientist but if you take a common sense approach and really look beyond the tricks the magician tries to play and distract you with - you will reach your own more valid conclusions generally.
Think about WHAT is not shown, or presented. It is often key to seeing the whole picture. As any artist knows “space” is as much important as the scratchings on the surface. Learn to see that space.
Keep reading with a 7-day free trial
Subscribe to NAKED AND ALIVE to keep reading this post and get 7 days of free access to the full post archives.